The Ultimate Guide to Measuring Process Improvement Success
Table of Contents
Why Should Teams Measure Success in Process Improvement?
The KPIs and Metrics That Matter When Measuring Process Improvement Success
Establishing Baselines and Goals
Whether you’re streamlining production in a manufacturing plant, optimising customer service workflows, or evaluating the effectiveness of your staff onboarding, the ability to measure success is paramount.
It’s here that Key Performance Indicators (KPIs) and metrics can come into play, helping you evaluate the impact and effectiveness of the process improvement initiatives your organisation is investing budget and resources into.
In this guide, we’ll delve into the significance of KPIs and metrics in the context of process improvement and explore the key indicators that can help provide valuable insights on your journey towards process excellence.
Table of Contents
Why Should Teams Measure Success in Process Improvement?
The KPIs and Metrics That Matter When Measuring Process Improvement Success
Establishing Baselines and Goals
Why Should Teams Measure Success in Process Improvement?
Before we dive into specific KPIs and metrics, let’s underscore why measuring success is so important.
Quantify Progress
By measuring your process improvement activities against KPIs, you’ll be able to see concrete, measurable data points that allow you to see just how much you’ve progressed.
This could be the difference between feeling like there might be a difference and being able to speak to just how much things have improved.
It can be especially helpful in helping you communicate the why to your organisation and getting leadership buy-in for future initiatives.
Todd Energy has done this by comparing the number of processes they were able to automate pre- and post-Flowingly. This showed them that their rate of automation has scaled by 7x, with their team on track to automate more than 35 processes in their first 12 months, having automated 9 processes in the 3 years prior.
Diagnose Problem Areas
KPIs and metrics can serve as diagnostic tools, pinpointing areas in your processes where there are bottlenecks.
This data is invaluable for making informed decisions around where you should be focusing your improvement efforts. These metrics can also reveal unexpected opportunities for optimisation.
At Glenelg Shire Council, one single process (Kerbside Waste & Recycling Request) was taking their team 430 hours a year. This process now takes 61 hours, which adds up to over 9 weeks of a full-time job saved on a single process.
Resource Optimisation
Armed with data-backed insights, you can allocate resources strategically.
By directing your efforts and investments towards areas that yield the most significant improvements, you ensure that your resources are being used most efficiently.
While Flowingly enables you to enable anyone in your organisation to automate and map processes, having a roadmap and priorities can help ensure your process improvement efforts are more focused.
By measuring the speed that Todd Energy could scale their process automation with Flowingly, they were able to see the value of adding additional resource. They have now trained up six workflow builders across the organisation and have developed frameworks to democratise and embed process automation across the business.
Continuous Improvement
Measuring success in process improvement provides valuable data-driven insights. It allows teams to learn from both successes and failures, understanding what worked and what didn’t.
Armed with this knowledge, teams can adapt their strategies and approaches over time. Continuous learning ensures that process improvement efforts evolve to become more effective and aligned with changing organisational goals.
Competitive Advantage
Measuring the success of your initiatives also helps organisations enhance the efficiency and quality of their products or services. This, in turn, can lead to a competitive advantage in the market.
Streamlined processes often result in improved customer experiences. Satisfied customers are more likely to become loyal and refer others, strengthening a company’s market positioning.
The KPIs and Metrics That Matter When Measuring Process Improvement Success
Now, let’s explore the KPIs and metrics that matter most in the realm of process improvement.
Process Time (or Cycle Time in the BPA world)
This is the time it takes to complete a process from start to completion. This is a critical metric to measure, especially when looking at the efficiency gains being made through process mapping and automation.
Reducing the time required to complete a process will lead to enhanced efficiency and responsiveness, as well as improved customer satisfaction.
According to a study by McKinsey, companies that focus on reducing cycle times can achieve a 20-50% increase in process efficiency.
According to a report by Deloitte, companies that excel in reducing process cycle times are 2.5 times more likely to be leaders in their industries.
Quality Metrics
Metrics such as NPS, error counts, or customer complaints can often help you assess the quality of your processes.
A focus on high-quality outputs not only reduces errors but also enhances customer trust and loyalty. These metrics are also often linked to things like process time, with faster, more consistent output improving your quality metrics.
Increasing customer retention rates by just 5% can increase profits by between 25% and 95%, as reported by Bain & Company.
Employee Satisfaction
Engaged and satisfied employees are more likely to contribute positively to process enhancements.
Regular surveys can provide valuable insights into employee morale and help identify areas where support or changes are needed.
Gallup found that companies with engaged employees outperform their competitors by 147% in earnings per share.
Return on Investment (ROI)
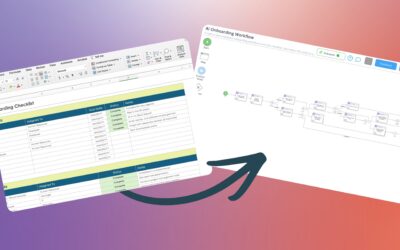
When starting out on your process improvement journey, make sure you identify and create a list of all the processes that you are looking to map and automate.
If these processes are currently done manually, make sure you run through the tasks involved with employees and calculate the average number of hours that it takes to perform each task, as well as the rough cost of the respective hours.
By creating a benchmark for current productivity, you can easily compare pre- and post-implementation data.
An easy way we like to do this is by looking at two key metrics:
- The time saved per process/request
- The overall time savings across all your processes
This can give teams a good indication as to the processes that have seen the most significant improvements as well as the overall ROI of their process improvement initiatives.
A study by McKinsey & Company revealed that organisations can achieve cost savings of 20-30% by implementing business process automation.
Compliance Metrics
In regulated industries, adherence to compliance standards is non-negotiable.
Monitoring and ensuring compliance with relevant regulations and standards is essential to avoid potential legal and financial repercussions.
Resource Utilisation
Evaluate how efficiently resources such as labour, materials, and equipment are being utilised within your processes.
Optimising resource allocation can lead to cost savings and improved overall performance.
Measuring success in process improvement involves not only collecting data but also making informed decisions that drive meaningful change.
A study by the Society for Human Resource Management (SHRM) found that organisations that effectively manage resource utilisation can reduce overhead costs by 15-20%.
Establishing Baselines and Goals
One essential step that is often overlooked but critical to success is the establishment of baselines and goals. These benchmarks act as your starting point and destination, guiding your journey towards enhanced efficiency and performance.
In this section, we’ll delve into the significance of setting baselines and goals and how to do it effectively.
Why Baselines Matter
Before you can improve a process, you need to understand where it currently stands. This is where baselines come into play.
A baseline is a snapshot of your process’s current state, capturing its performance metrics, quality, and efficiency. By establishing a baseline, you gain clarity on what needs improvement, helping you identify pain points and opportunities for enhancement.
Defining Clear Goals
Once you have a baseline, it’s time to set your improvement goals. Goals in process improvement should be Specific, Measurable, Achievable, Relevant, and Time-bound (SMART).
For example, rather than setting a vague goal like “improve customer satisfaction,” aim for a SMART goal like “reduce customer complaint resolution time by 20% within six months.”
Your improvement goals should align with your organisation’s broader objectives.
Consider how your process improvements contribute to the company’s strategic goals.
The Baseline-Goal Continuum
The relationship between baselines and goals is dynamic. As you make improvements, your baseline should evolve to reflect the new normal. Continuously update your baseline to reflect the process’s improved state. Simultaneously, revisit and adjust your goals to maintain a challenging yet achievable trajectory for improvement.
The KPIs and metrics you select should align with your organisation’s specific goals and reflect the improvements you aim to achieve.
By consistently tracking and analysing these indicators, you can navigate your process improvement initiatives toward success, fostering a culture of continuous refinement and innovation. Remember that success isn’t just about reaching a destination; it’s about the ongoing journey of improvement and growth.
The Flowingly Blog
Get the flow-down on all things Flowingly. From process tips to product, we cover everything you need to level up your processes.
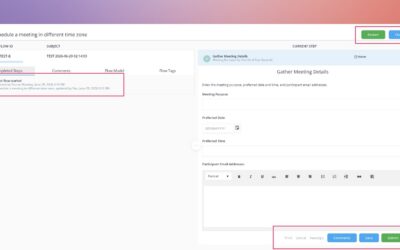
Test Your Workflows Before They Go Live
We’ve introduced workflow testing, a new feature that lets you run through your workflows before pushing them live.
Introducing Tabs in Modeler
We’ve refreshed the Process Details experience in Modeler with a new tabbed layout, so everything you need is right where you’re already working.
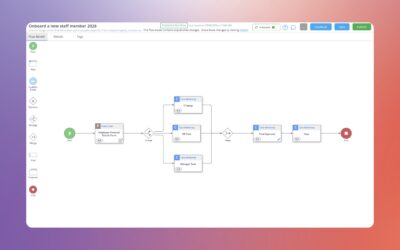
Meet Flowingly’s New AI Workflow Builder
We’ve introduced our new AI Workflow Builder.
Instead of manually building every step, you can describe how the process works – and Flowingly will draft the workflow for you and give you a solid starting point you can actually work from.